Overview
The app's built-in help for this screen, as shipped in quodeq 1.13.1. Edit this page on GitHub
The Overview tab is a project's landing page: the accumulated quality picture plus the fastest routes into the details.
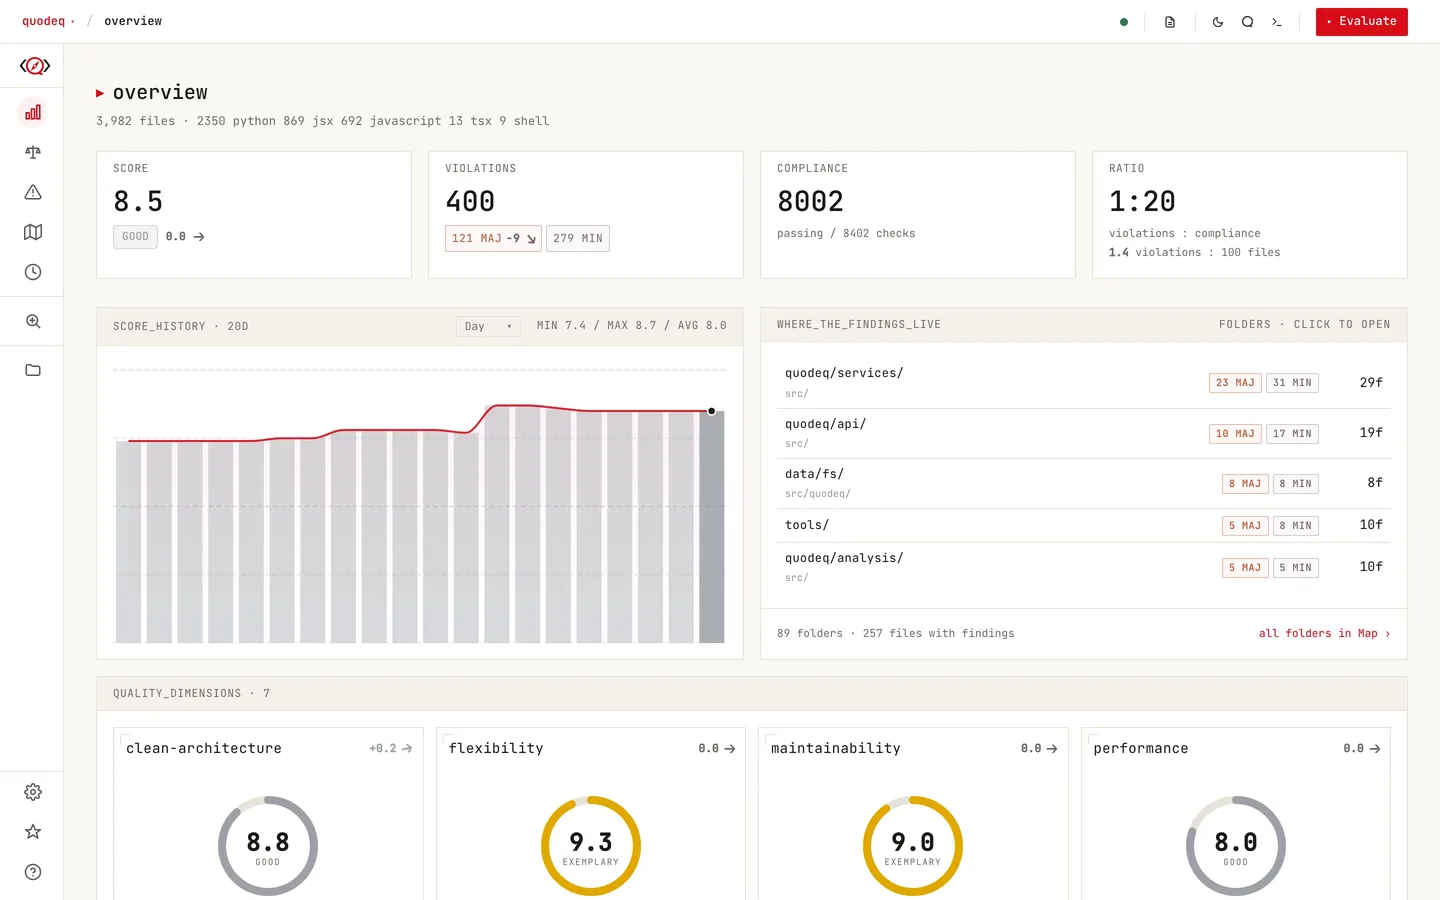
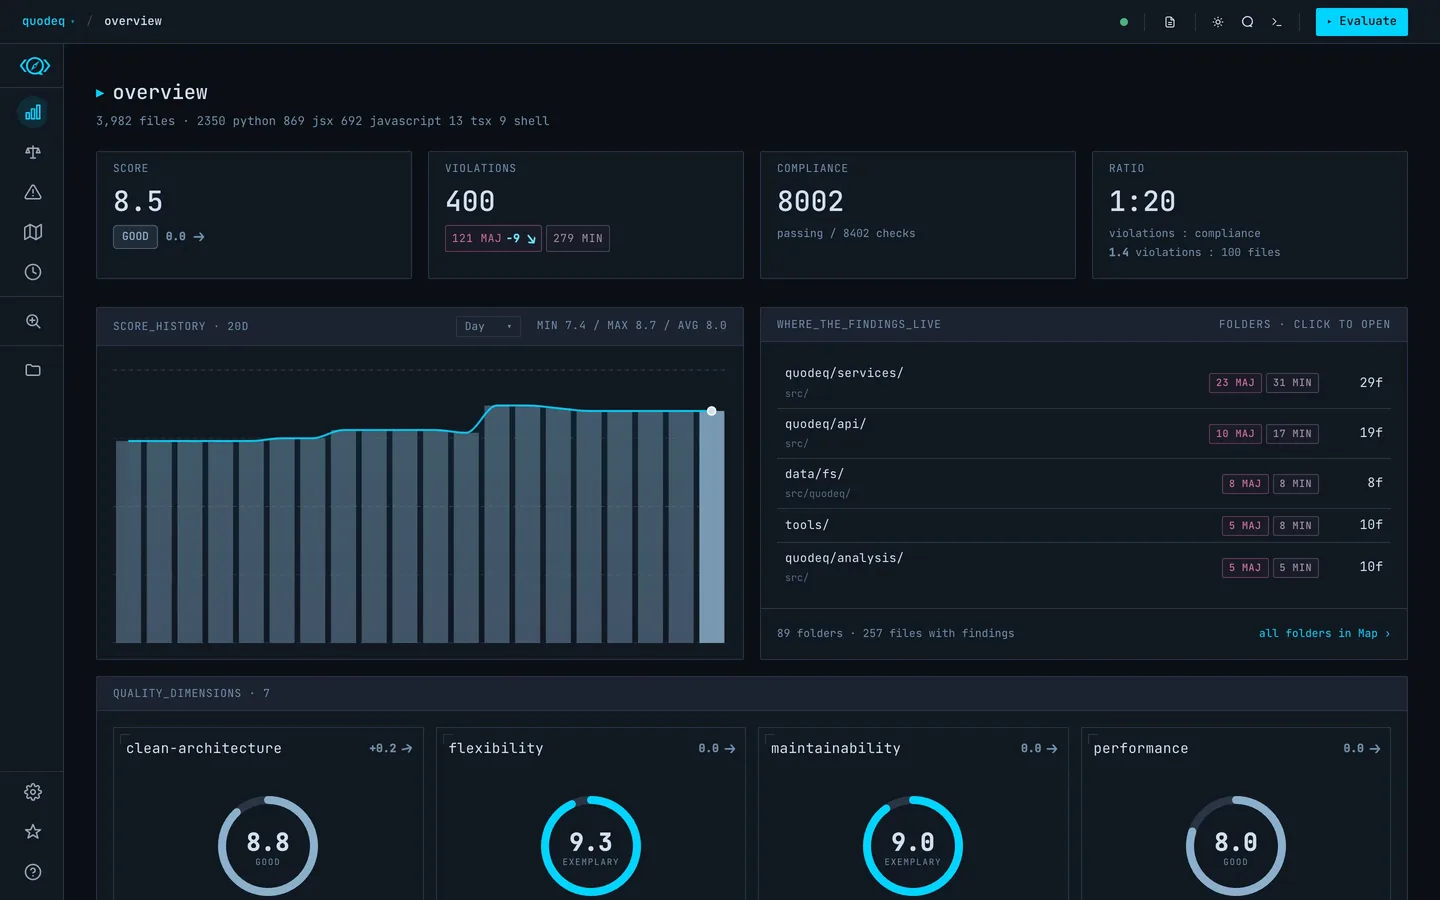
Accumulated scores
Overview shows the latest scored result for each dimension, even when those results come from different runs. Evaluate security today and maintainability tomorrow; both appear side by side, each card labeled with the run that produced it. To inspect a single run instead, open it from History.
Header stats
- Score the overall number and grade, with a delta against the previous run.
- Violations active findings with severity badges. The CRIT and MAJ badges carry their change since the baseline run (the previous finished run): down is good, up is bad, and a badge with no change shows no arrow. When both runs recorded a commit, the arrow counts only the files that changed between them, so re-sampled untouched files do not move it; otherwise it counts every file. Click the stat, or a single badge, to open a project-wide findings view filtered to that severity.
- Compliance evidence of good practice. Click it to browse the compliant findings.
- Ratio violations to compliance:
1:3means three compliant checks per violation. - Density under the ratio, violations : 100 files: violations per 100 files read across the dimensions shown. A run that recorded no files-read count shows no density.
Panels
- Score history runs over time, groupable by day, week, or month. See History & Trends.
- Dimension scores one bar per dimension. Click a bar to open that dimension in the Explorer.
- Dimension cards a gauge per dimension with principle detail. Click a card to open the Explorer anchored to the run behind the score.
- Violations by file the worst files, sorted by severity. Click a row to open the file detail.
The report
The Report button in the top bar renders the whole overview as a Markdown report in the side pane, ready to download and share outside quodeq. The report opens with the header's numbers (score, violations, compliance, ratio, then criticals, majors, open types, density) and one since-baseline section with counts only. The raw violations total also appears in its summary at the end.