Code Map
The app's built-in help for this screen, as shipped in quodeq 1.13.1. Edit this page on GitHub
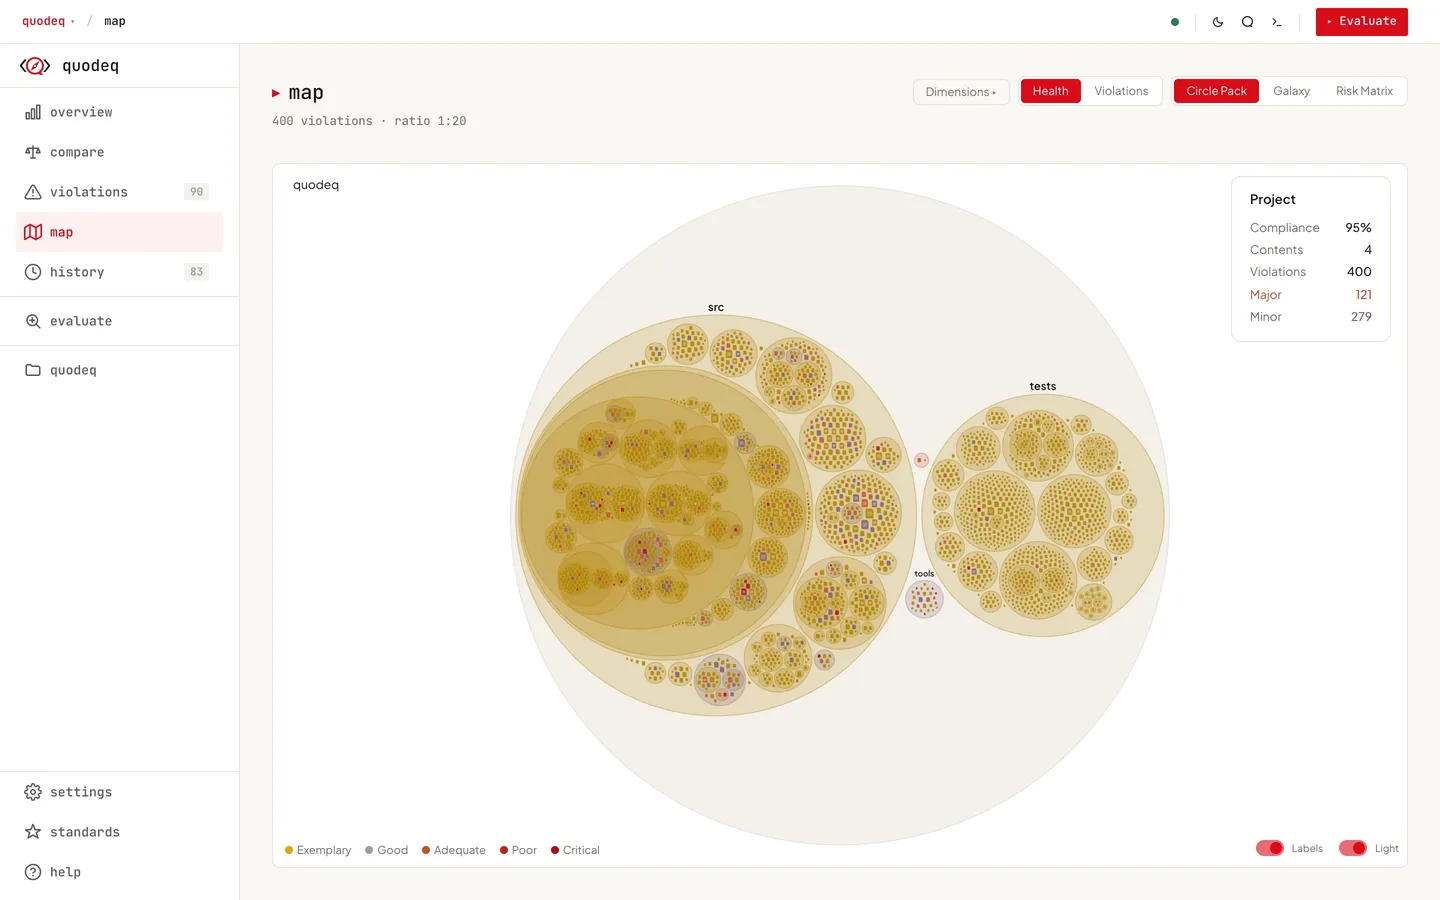
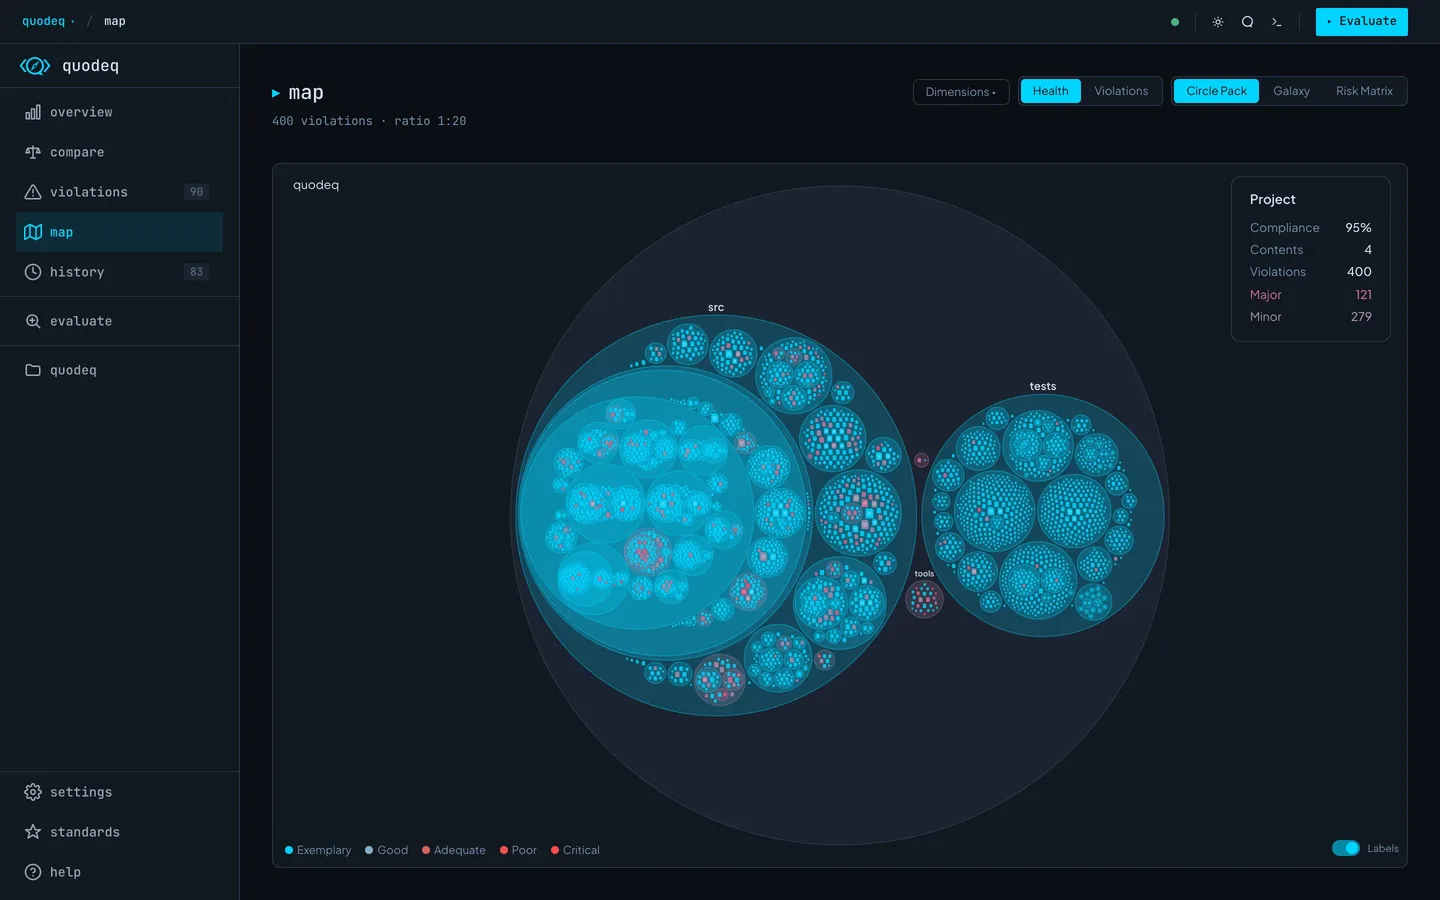
The Map tab draws your codebase as shapes you can scan at a glance: two metrics crossed with three layouts.
Pick a metric
- Health color encodes the dimension grade of each file. Greener is healthier.
- Violations color encodes raw violation density, weighted by severity.
Pick a layout
| Circle Pack | Nested circles sized by line count. Best for spotting heavy files at a glance. |
| Galaxy | Force-directed cluster view. Two sub-modes: filesystem (by directory) or standards (by violated principle). |
| Risk Matrix | Files plotted by complexity (size) vs. issue density. Top-right quadrant is your priority list. |
Filter by dimension
The Dimensions pill in the map controls narrows every layout to the dimensions you tick. A dot on the pill reminds you a filter is active.
Reading the views
- Large red blocks big files with many issues, high-impact refactor targets.
- Clusters of red entire modules drifting from the standard.
- Galaxy by standards reveals which principles are violated most across the project, regardless of where the files live.
- Green islands: well-maintained areas. Protect them when refactoring nearby.
Drilling in
Click any node to drill down. The Map keeps a local breadcrumb so you can pop back without leaving the tab. Click a leaf node to open the file detail, or jump from a galaxy-by-standards cluster directly to the offending principle.